Create a data-driven culture with BI
Power BI
Power BI applications and licensing
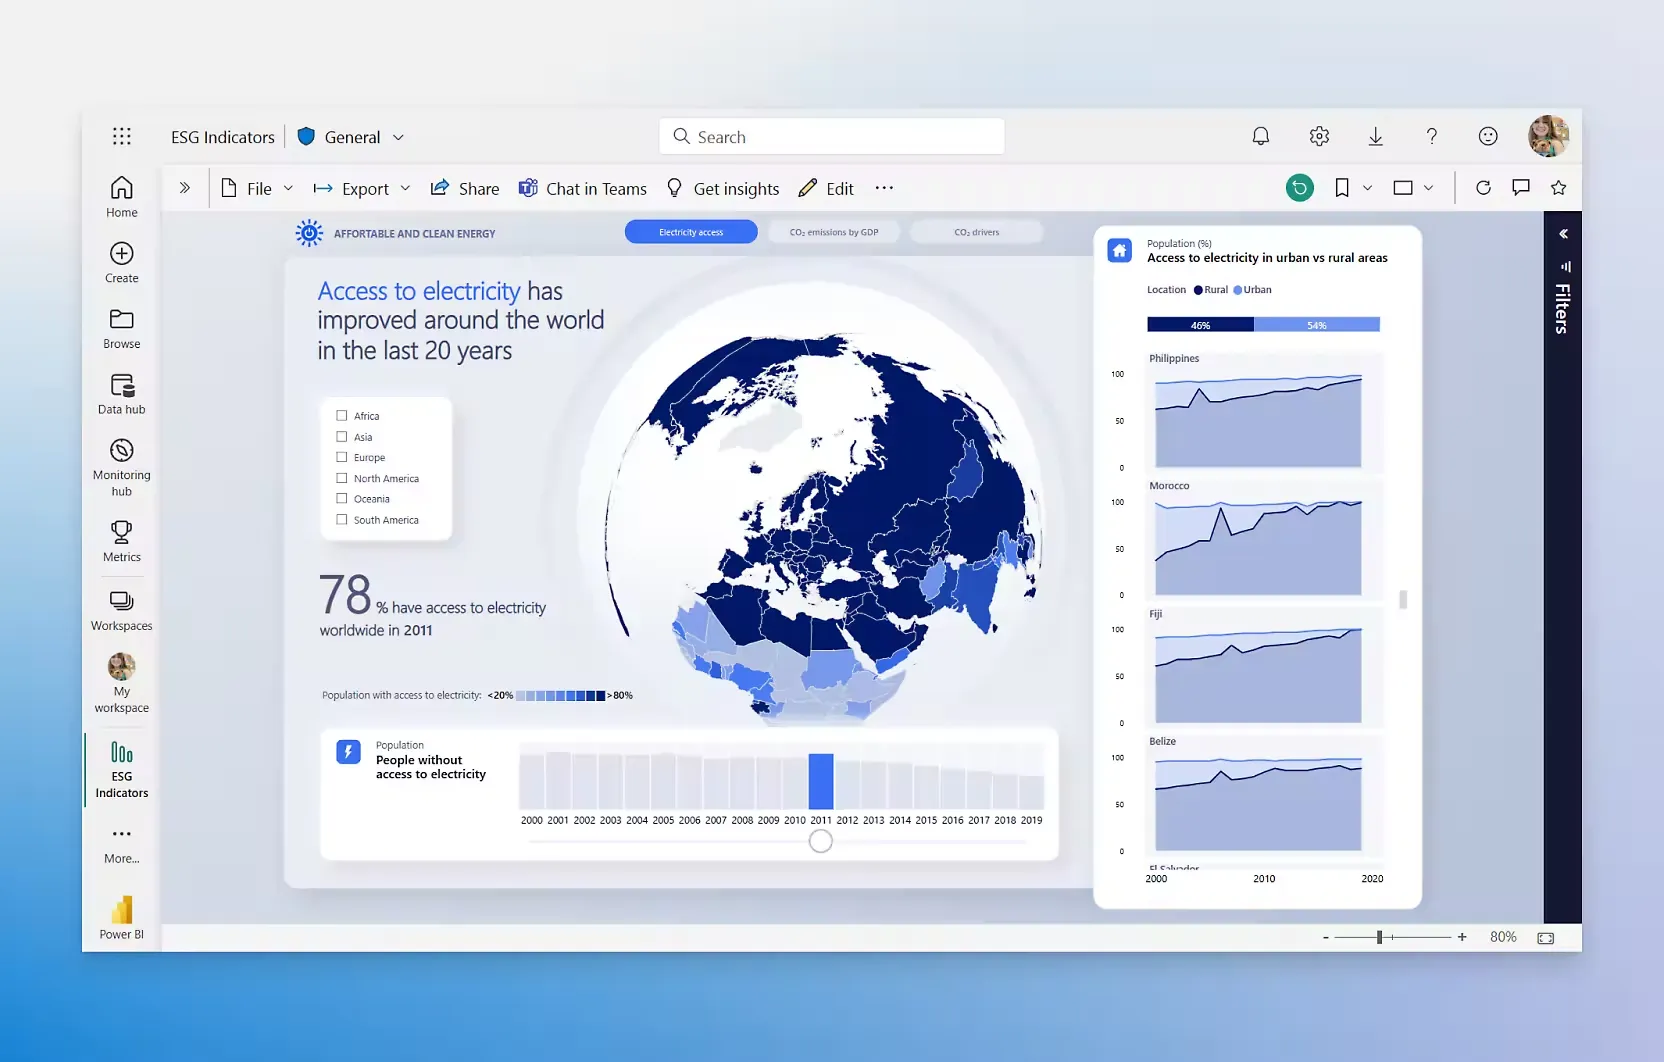
Power BI provides a cost effective and easy way to gather data from different sources, transform and present it with easy to understand visual graphics. Envision IT carries out Power BI applications (or apps) development and is Microsoft authorised Power BI reseller. Commercial / government, Charity / Non Profit and education / academic organisations can purchase Power BI licenses from Envision IT under the CSP plan. You have the option of engaging Envision IT to develop Power BI apps and / or purchase Power BI licenses. On this page, we are briefly touching upon Power BI app development and licensing aspects. Contact us for more details. Take a tour of Power BI>>
Why Power BI
High scalability - from a little to petabytes of data and one to thousands of users!
Power BI provides a highly scalable platform that allows from a small amount of data in SMB space to petabytes of data with enterprise-grade ingestion. Its modeling tool can scale from one to thousands of users.
Sharing data insights everywhere
Power BI allows you to embed and share reports in your other Microsoft services, including Teams, PowerPoint, Excel, and Power Platform.
Make use of AI within Power BI
Power BI brings to you easy-to-use AI features that can find patterns in data, create reports instantly, provide answers, and more.
Data governance and protection
Power BI with Microsoft governance, security, and compliance provides you with end-to-end visibility of data that enable you meet your governance and data protection requirements .Know more>>
How to license Power BI?
You can license Power BI in four ways i.e. Free account (getting started or light use), Power BI Pro (most common), Power BI Premium per user (Power BI PPU) and Power BI Embedded. These are explained below:
Free Account
Free i.e. no cost
A free account allows you to create rich, interactive reports that put visual analytics at your fingertips.
- It is included in Microsoft Fabric free account
- No credit card required
- You can upgrade to Power BI Pro or Power BI Premium to share reports
Power BI Pro
AU$14.00 EX GST
price for one user for one month with yearly commitment
GST @ 10% applies when billed to entities in Australia. GST is nil when billed to entities outside Australia.
With Power BI Pro, you can develop, publish and share Power BI reports with others. Please see below ' How Power BI Works or used'.
- Publish and share Power BI reports
- It is included in Microsoft 365 E5 and Office 365 E5
- Dataset limit of 1 GB
- Each user who needs to create and share reports and dashboards must have a Power BI Pro license
- Suitable for small to medium size teams
- You buy Power BI license from Envision IT under the CSP plan.
Power BI Premium Per User
AU$28.50
price for one user for one month with yearly commitment
GST @ 10% applies when billed to entities in Australia. GST is nil when billed to entities outside Australia.
Power BI Premium Per User (Power BI PPU) provides data professionals with access to enterprise-scale features.
- It includes all the features available with Power BI Pro
- It provides access to larger model sizes
- More frequent refreshes
- Dataset limit of 400 GB
- You buy Power BI license from Envision IT under the CSP plan
Power BI Embedded
Variable
Power BI Embedded enables you to create customer-facing reports, dashboards, and analytics in your own applications.
- You can Brand Power BI reports with Power BI Embedded as your own
- You can automate monitoring, management, and deployment
- It reduces developer overhead
Type of Power BI Projects
The Power BI projects invariably involve accessing data from one of more applications, transform and present it with visualisations e.g.:
- Sales analysis - gather sales data from different systems such as accounts, quotes, bank and present it regionwise, salespersonwise, forecasting and projections etc.
- Manufacturing analysis - gather data from manufacturing systems, accounts and billing, goods receipt and generate reports on production, status of raw materials or finished goods, alerts when raw material falls low or payments not received etc. You can do some of these things with DK Sense - www.dksense.com.
- Project management - connect to project management accounts to gather data and present overall project status with different parameters such as people involvement, project progress etc.
- Cyber Security - analyse logs for anomalies
- Income - expenditure analysis
- and many more...
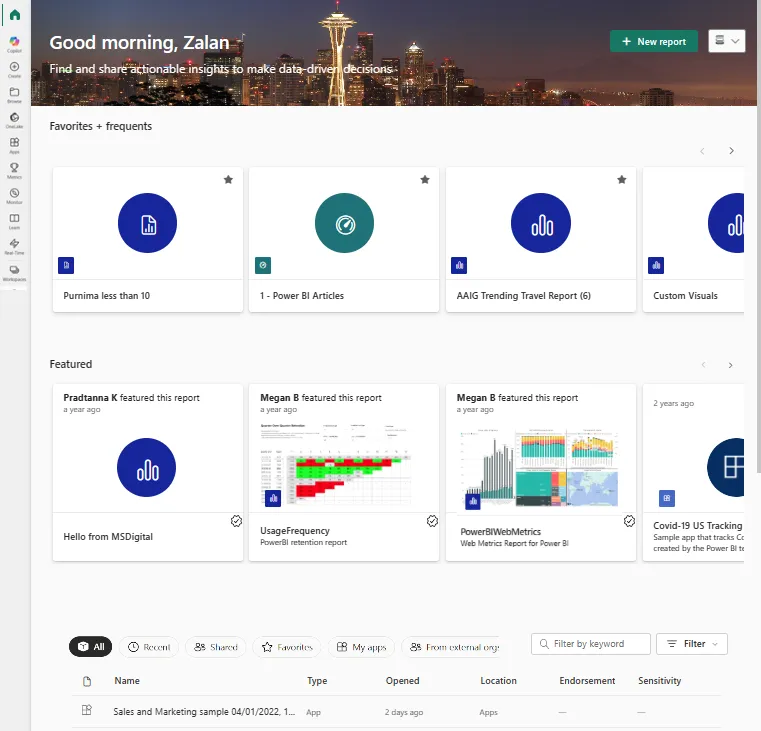
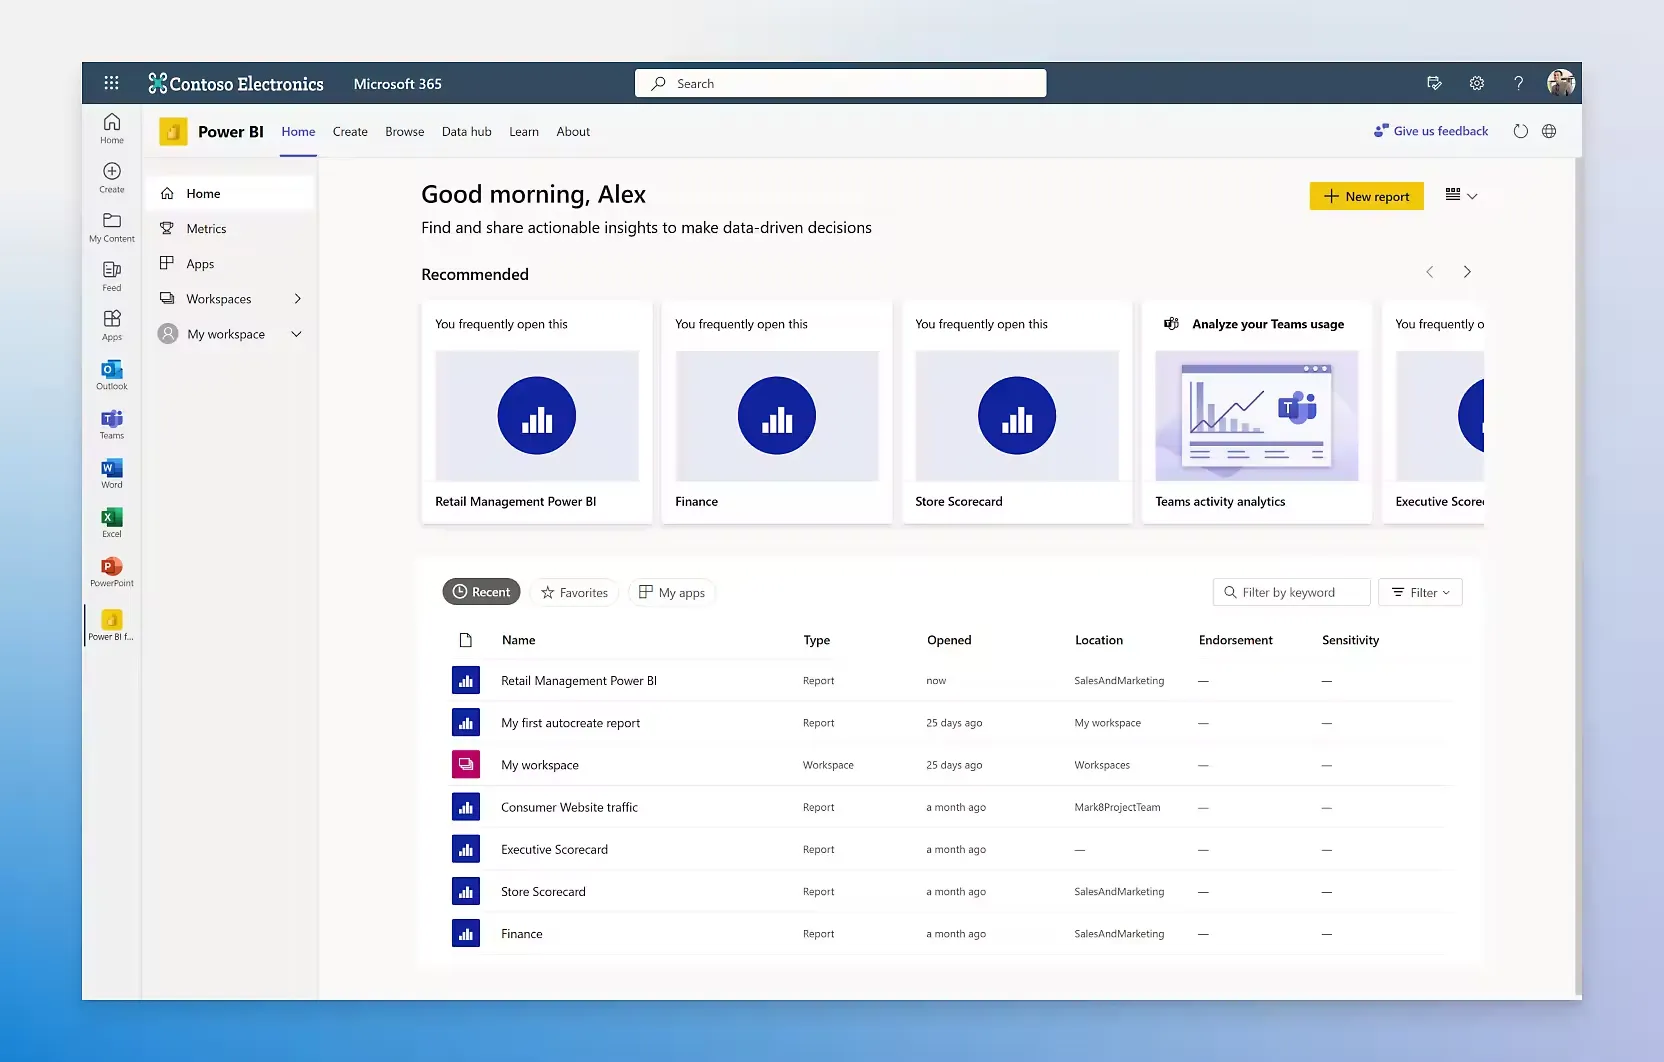
How Power BI works or is used?
You use Power BI either as a designer or business user. A Power BI designer (such as Envision IT or someone in your organisation with a good knowledge of Power BI) develops semantic models, dashboards and reports. Power BI designers use 'Power BI Desktop' to develop these. Power BI desktop is a free license and used for creating and publishing reports and dashboards. It is primarily used for report development and doesn’t require a license. The dashboards and reports are used by business users for their day to day work. For this purpose you will need to have a 'Power BI Pro' or Premium Per User (PPU) license. Alternatively, your organisation should has Power BI Premium subscription, and the content being shared with you comes from Premium capacity. Know more by visiting - Basic concepts for the Power BI service business user>> .
The Parts of Power BI
Power BI consists of several elements that all work together, starting with these three basics:
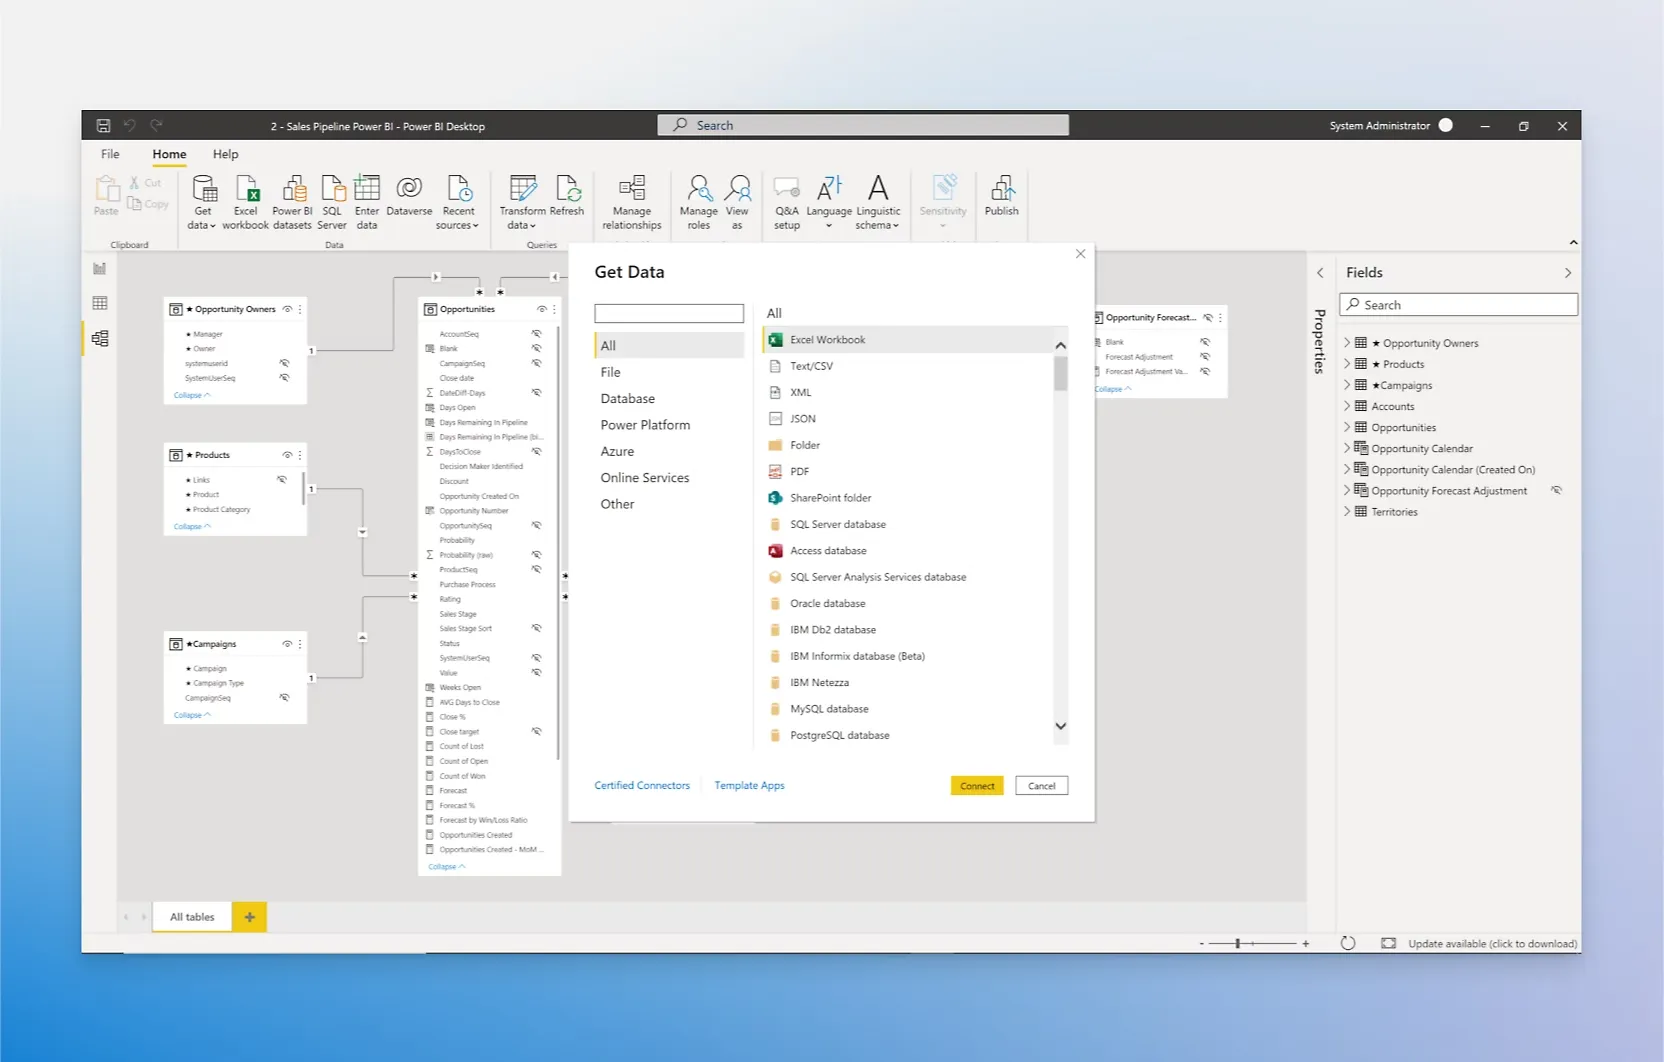
- A Windows desktop application called Power BI Desktop.
- An online software as a service (SaaS) service called the Power BI service.
- Power BI Mobile apps for Windows, iOS, and Android devices.
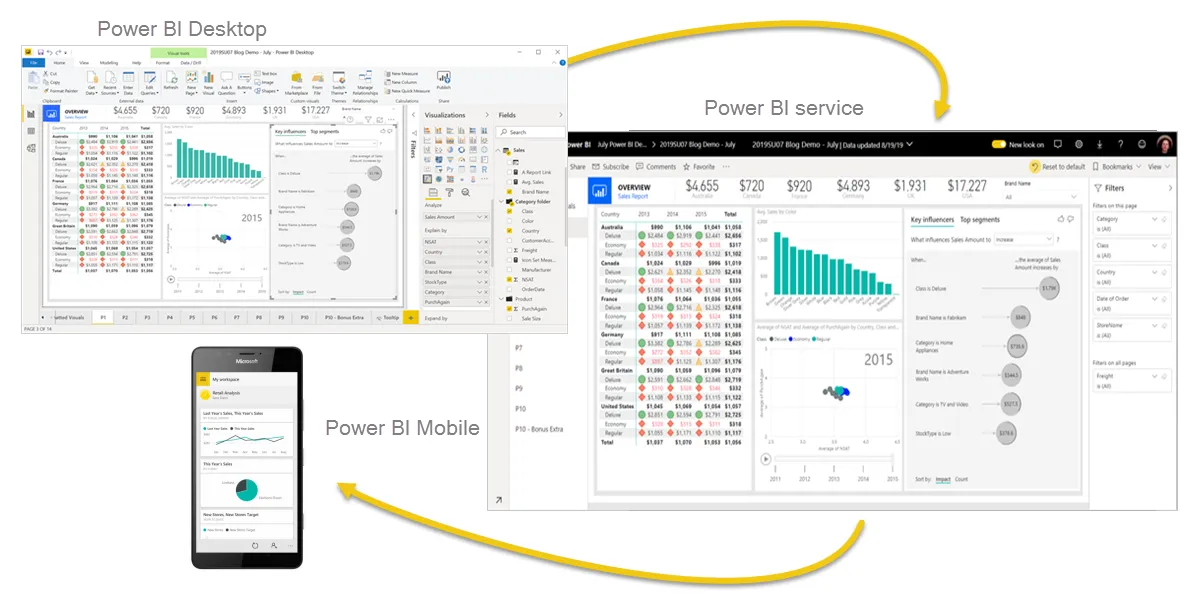
These three elements—Power BI Desktop, the service, and the mobile apps—are designed to let you create, share, and consume business insights in the way that serves you and your role most effectively.
Beyond those three, Power BI also features two other elements:
- Power BI Report Builder, for creating paginated reports to share in the Power BI service. Read more about paginated reports later in this article.
- Power BI Report Server, an on-premises report server where you can publish your Power BI reports, after creating them in Power BI Desktop. Read more about Power BI Report Server later in this article.Know more>>
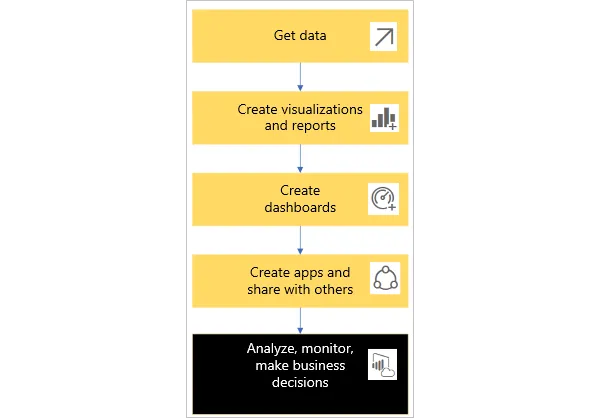
Power BI concepts
A typical Power BI workflow involves more than one type of content. A Power BI designer (yellow in the diagram) collects data from semantic models, brings it into Power BI Desktop for analysis, and creates reports full of visualizations that highlight interesting facts and insights. The designer pins visualizations from reports to dashboards, and shares the reports and dashboards with business users like you (black in the diagram). There are many different ways that a designer can share content with you: as individual pieces of content, content bundled together in an app, or by giving you permissions to a workspace where the content is stored. Learn more about Power BI concepts
Power BI Capabilities
Uncover Insights With AI
Turn your data into visuals with advanced data-analysis tools, AI capabilities, and a user-friendly report-creation tool.
Bring All Your Data Together
Create datasets from any source and add them to the OneLake data hub to create a source of truth for your data.
Turn Insights Into Impact
Help users make better decisions by infusing insights into the apps they use every day, like those in Microsoft 365.
Empower Every Data Team
Reshape how your organization accesses, manages, and acts on data by activating Microsoft Fabric in your Power BI experience. Know more>>
Power BI Pro
Overview
License individual users with modern, self-service analytics for publishing reports and viewing content.
Self-Service BI
Enable users to create reports and publish them to share with their coworkers, helping to foster self-service BI.
Microsoft 365 E5
Get Power BI Pro with other Microsoft 365 apps and industry-leading Microsoft security for one low price per user.
How Power BI Matches Your Role
How you use Power BI depends on your role in a project or on a team. Other people, in other roles, might use Power BI differently.
For example, you might primarily use the Power BI service to view reports and dashboards. Your number-crunching, business-report-creating coworker might make extensive use of Power BI Desktop or Power BI Report Builder to create reports, then publish those reports to the Power BI service, where you view them. Another coworker, in sales, might mainly use the Power BI Mobile app to monitor progress on sales quotas, and to drill into new sales lead details.
If you're a developer, you might use Power BI APIs to push data into semantic models or to embed dashboards and reports into your own custom applications. Have an idea for a new visual? Build it yourself and share it with others.
You also might use each element of Power BI at different times, depending on what you're trying to achieve or your role for a given project.
How you use Power BI can be based on which feature or service of Power BI is the best tool for your situation. For example, you can use Power BI Desktop to create reports for your own team about customer engagement statistics and you can view inventory and manufacturing progress in a real-time dashboard in the Power BI service. You can create a paginated report of mailable invoices, based on a Power BI semantic model. Each part of Power BI is available to you, which is why it's so flexible and compelling. Know more>>
Explore documents that pertain to your role:
- Power BI for business users
- Power BI Desktop for report creators
- Power BI Report Builder for enterprise report creators
- Power BI for administrators
- Power BI for developers
How Microsoft Fabric works with Power BI
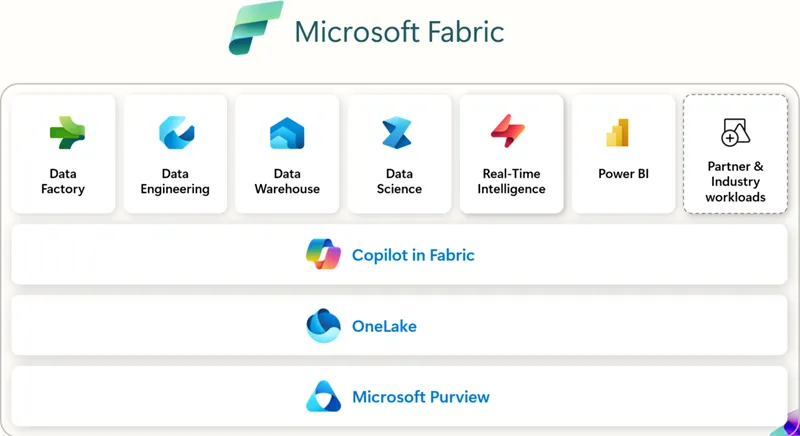
Microsoft Fabric is an offering that combines data + services in a unified environment, making it easier to perform analysis and analytics on various sets of data. Power BI is an example of one of the services that's integrated with Microsoft Fabric, and your organization's OneLake data store is an example of the data that can be used, analyzed, or visualized. Large organizations find Microsoft Fabric particularly useful, since it can corral and then bring greater value to large stores of data, then using services (like Power BI) to bring such data to business life.
Administration of Power BI is now handled by Microsoft Fabric, but your favorite tools like the Power BI service and Power BI Desktop still operate like they always have - as a service that can turn your data, whether in OneLake or in Excel, into powerful business intelligence insights. Know more>>
Get in Touch!
What's your vision? Contact us today to find out how we can help you realise it .